Since the death rate is now approximately constant a simple linear least squares model can be used to figure out when we will hit the following milestones:
| Total US Deaths | Date |
| 100000 | 5/18/2020 |
| 200000 | 7/6/2020 |
| 300000 | 8/24/2020 |
| 400000 | 10/11/2020 |
| 500000 | 11/29/2020 |
| 600000 | 1/17/2021 |
| 700000 | 3/6/2021 |
| 800000 | 4/24/2021 |
| 900000 | 6/12/2021 |
| 1000000 | 7/30/2021 |
Average deaths per day for May 1-3 2020 US States
| New York | 308 |
| New Jersey | 257 |
| Massachusetts | 142 |
| Michigan | 116 |
| Illinois | 102 |
| California | 95 |
| Connecticut | 90 |
| Pennsylvania | 63 |
| Indiana | 58 |
| Florida | 48 |
| Texas | 33 |
| Georgia | 31 |
| Maryland | 30 |
| Colorado | 28 |
| Minnesota | 26 |
| Ohio | 23 |
| Louisiana | 23 |
| North Carolina | 21 |
| Virginia | 18 |
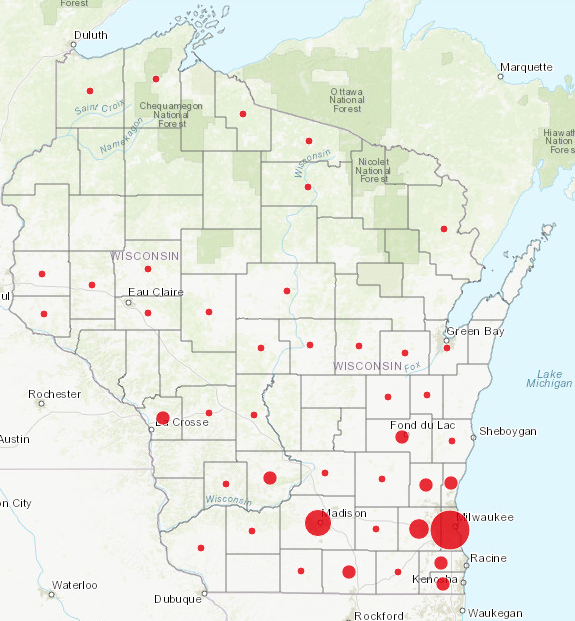
Wisconsin only had 1 new death today but Eau Claire county had 5 new cases.
Haven't done the Wisconsin sequence for a while so here it is:


Comments
Post a Comment