Sunday March 29 2020
The CDC has not update the US map since 3/26 but I did find a set of data going back to the first infection on one of the other pages.
I think Wisconsin usually takes Sunday off too. So here are the latest graphs:


Not too much to tell today. Had cereal for breakfast and spaghetti for lunch with tomato sauce and pesto. Worked on my classes. I think I will be ready for Monday.
This reminds me of a Nanotechnology joke I used to tell:
In a nanotech war for the first two weeks nothing appears to happen, then everyone on the losing side disappears.
I think Wisconsin usually takes Sunday off too. So here are the latest graphs:

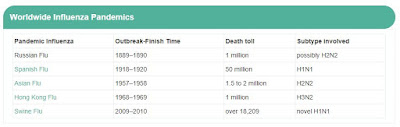
I did find this one:

I made a graph showing the percentage increase along with a five day running average. Very noisy data:

It looks like it might be trending down a bit so that would be good.
This reminds me of a Nanotechnology joke I used to tell:
In a nanotech war for the first two weeks nothing appears to happen, then everyone on the losing side disappears.


Comments
Post a Comment